CS280 "Computer Vision"
Homework 1, Feb-2002.
Siddharth JainĀ, Cheng Chang ,ĀAlmudena Konrad
( morpheus@eecs.berkeley.edu,Ā
cchang@eecs.berkeley.edu,Ā almudena@cs.berkeley.edu
)
Written items
1. An absorbing medium.
- Expression for the radiance transferred from one surface patch of small area
(dA) to another of small area in the presence of this medium
(Equation 1)
or
(Equation 2)
which is the expression for the radiance transferred from one
surface patch to another separated by a distance of x.
- Distribution of light.
2. Lambertian nor specular surface.
A CD surface acts as a diffraction grating,
separating white light into all the rainbow colors. An interesting
phenomenon is the change of colors caused by the CD as we tilt the
surface back and forth. Light waves reflected from the CD surface
overlap and interfere with each other producing this coloring
effect. This is known as interference. For a given viewing angle
 , constructive interference occurs
such that the rays from adjacent tracks each travel an extra distance
of
, constructive interference occurs
such that the rays from adjacent tracks each travel an extra distance
of  , where is n is an integer that
denotes the order of the image (see to Equation 3)(Ref [1]).
Changing the angle ,
causes different wavelengths of light to constructively interfere.
When the viewing angle is small, shorter wavelengths such as blue, violet, and indigo
constructively interfere. At larger viewing angles, the longer
wavelengths such as red, orange, and yellow constructively interfere
(Ref [1]).
, where is n is an integer that
denotes the order of the image (see to Equation 3)(Ref [1]).
Changing the angle ,
causes different wavelengths of light to constructively interfere.
When the viewing angle is small, shorter wavelengths such as blue, violet, and indigo
constructively interfere. At larger viewing angles, the longer
wavelengths such as red, orange, and yellow constructively interfere
(Ref [1]).

(Equation 3)
where d is the grating constant and it represents the track
spacing in the CD.
Examples of biological surfaces that show similar properties are
insect wings (such as butterflies wings), hummingbird throat feathers,
and organisms having scales on their skin like snakes and fish - the
scales act as the diffraction grating.
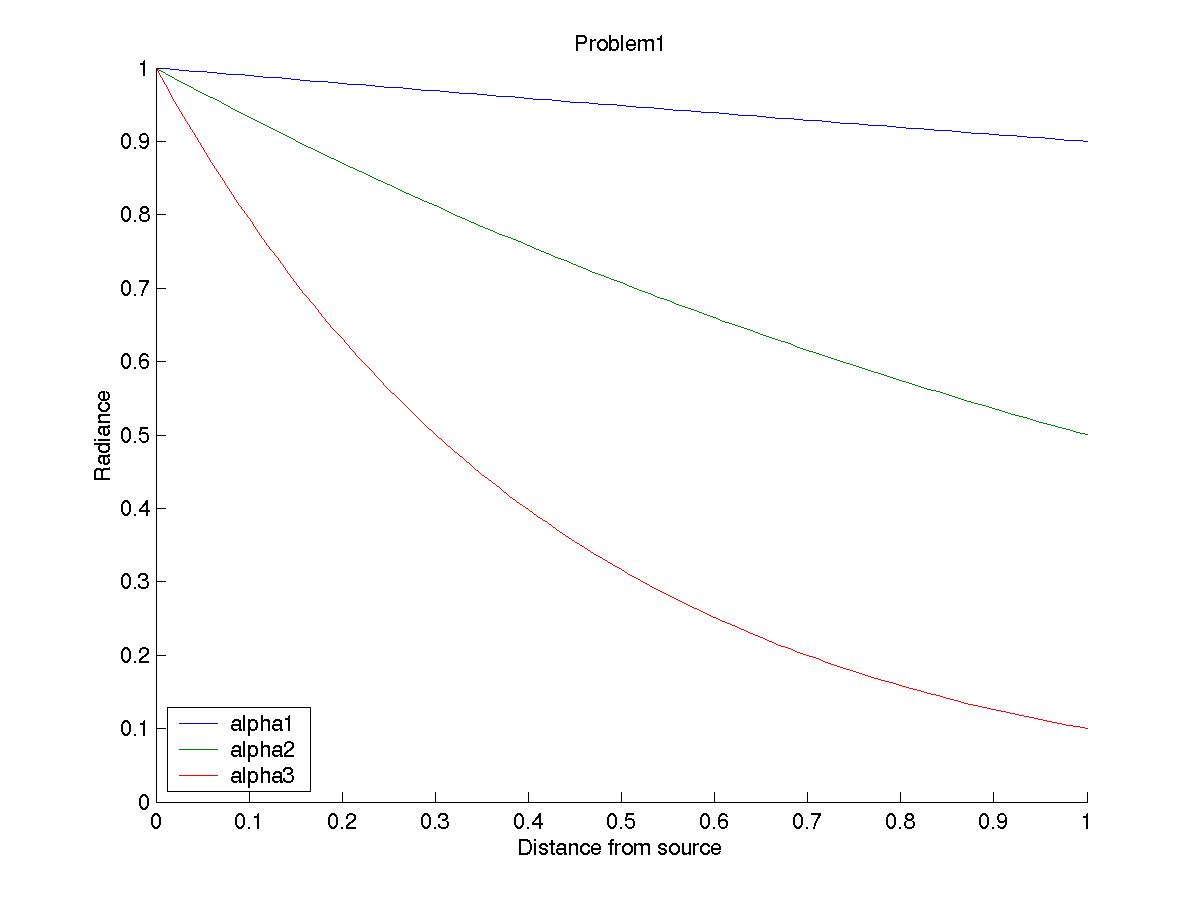
3. Volume color.
For the answer to this question we go back to Equation 2 in Problem
first. The translucent material, in this case the glass of wine, is a
uniform absorbing medium. A glass of red wine absorbs all the
wavelength strongly except the red wavelength. Furthermore, the red
wavelength component also decays exponentially, as showed in Equation
2, where N represents the observed intensity, N0 is the
original light intensity,  is the absorption
coefficient and x is the distance traveled through the medium.
is the absorption
coefficient and x is the distance traveled through the medium.
A small glass of sufficiently deeply colored red wine looks black
because the high concentration of colored pigment compensates for the
small distance traveled by the light. We have an exponential
attenuation of  .
.
A big glass of lightly colored red wine appears black because
even though the absorbance is low due to low concentration of colored
pigment, the distance is high because there is more wine in the
glass. We have an exponential attenuation of  .
.
 but
but  , therefore
the attenuation in both cases is relatively the same so the wine appears
black in both glasses.
, therefore
the attenuation in both cases is relatively the same so the wine appears
black in both glasses.
4. Scattering of light by air.
During daytime the sunlight is scattered by the air molecules
producing a blur between the observer and the mountains. We see the mountains because of the reflected and scattered light - so
they appear as blurred patches of low intensity.
We see the mountains because of the main beam
of light so they are much sharper and more visible. Note that light suffers
some attenuation in the air due to moisture.
Also note that at sunset an object overhead could appear blurred
just as the mountains appeared blurred in the daytime. We estimate the
distance for which air can be modeled as vacuum to be a few
Kilometers, (<10) .
Practical exercises
2. Illuminant and surface reflectance.
According to our observation, the most significant error
occurs in the light with low Wavelength (thus high frequency light).
The possible reason is that the color dataset we used has a larger
variance in low wavelength.
In Figure 2.1, with 5 principal components, Ā
Figure 2.2, with 7 principal components, Ā
Figure 2.3, with 10 principal components, Ā
Figure 2.4, with 12 principal components, Ā
and Figure 2.5, with 20 principal components, the Y_coordinates are the errors
(Euclidean distance from EXACT spectra to PCA spectra) the
X_coordinates are the wavelengths (from 380 nm to 800 nm).
4. Human color constancy.
Human color constancy is the mechanism by which humans see colors. It
refers to the lack of change in the perceived color of a surface as
the illumination changes. The Human Visual System does not exhibit
perfect color constancy. It also performs poorly in lighting with
abnormal spectral content such as fluorescent light [2].
There are a few researchers looking at the color constancy
problem. For example, D'Zmura and Iverson in 1998, introduced a new
approach to this problem which emphasizes the recovery of the spectral
properties of light sources and surfaces that combine to produce the
reflected lights that reach the eye. This approach relies on bilinear
models of the visual response to reflected lights, and our first aim
in this document, after a brief review of color constancy, is to
describe such bilinear models [3].
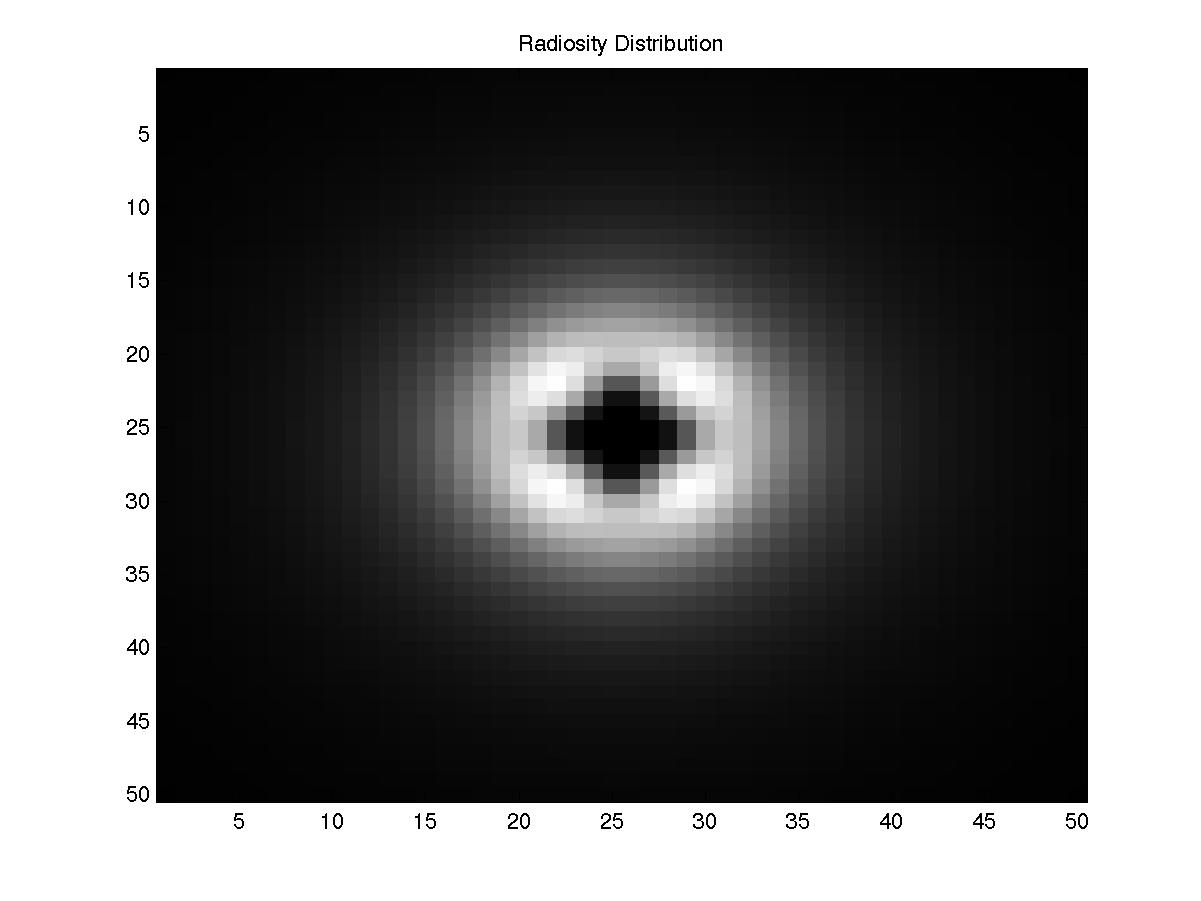
5. An area source approximated as a grid of point sources.
- The quantization errors is a direct consequence of the
discretization of the area source giving a finite number of grid
points. This means that if we are at a position P1 and
suppose n points are visible and m are invisible, then there is some
distance dmin such that if I move a distance less than
dmin, m and n do not change - which is the approximation we
make and which gives the quantization errors.
-
Figure 1Ā(
parameters), illustrates an area source of
approximately 12x12 grid, Figure 2Ā(
parameters), illustrates an area source of
approximately 25x25 grid, and Figure 3Ā(
parameters), illustrates an area source of
approximately 36x36 grid. From these figures, it is apparent that as the number of point
sources goes up, the quantization error goes down (i.e., the image
become more realistic and accurate).
- If we change the geometry keeping the number of points in the
source the same, then we can increase dmin.
Figure 4Ā(
parameters),Ā
Figure 5Ā(
parameters),Āand
Figure 6Ā(
parameters), show this effect. In these figures the occluder is
tilted at an angle of 45 degrees.
Thus, we find that Figure 1, gives an image which is more accurate
than the corresponding image for Figure 4, because dmin has
increased.
References
- http://fusioned.gat.com/Teachers/Curriculum/Curriculum-HTML/T03S-CD-diffract.html
- http://web.media.mit.edu/~wad/color/constancy.html
- D'Zmura, M. & Iverson, G., A formal approach to color constancy:
the recovery of surface and light source spectral properties using
bilinear models. Mahwah, NJ: Lawrence Erlbaum
Associates, 99-132, 1998.
